|
.Javascript DHTML Drop Down Menu Powered by dhtml-menu-builder.com

Compression Curves
Compression curves for the
various processes are shown at the right. Compression has the highest
level just below the surface. We strive to create our compression
curves with these properties in mind. Polishing can therefore be done
without losing the compressive stress benefit. Doing so, reveals the
higher level of compression. When the entire processed surface is polished,
however, the turbulent flow improvement is no longer present.
For this reason, cosmetic critical
castings are only polished, after
MetaLL ife,
in the areas where subsequent casting polishing is difficult such as in
fillets and radius/radii.
Composite
Compression Curves
show overlay of differences in each process.
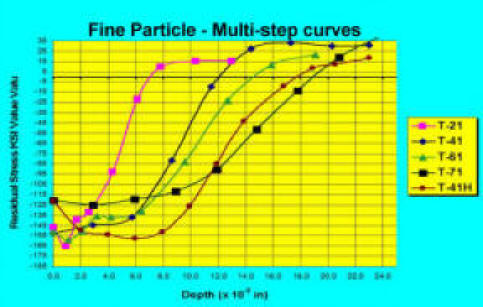
How the graphed curves were plotted.
MetaLL ife
processing is monitored on a production basis by using Almen intensity
strips. These strips are placed in strategic locations on the die or
perishable tooling being processed. The Almen strip will bend upward when
processed and by measuring the height of the center curvature, the approximate
amount of induced surface compression can be determined. Various strip thicknesses
are used (C,A,N strips) dependent on the intensity of the process. i.e. For example, a
T-21 process would use a thinner Almen strip than a more aggressive
T-41H.
While the Almen strip method is useful,
it only provides a relative basis for measuring surface induced
compression. Surface compression is important, but the depth and shape of
the curve is what ultimately determines how well the process variables are being
applied. The only accurate means for determining this residual stress
distribution, is by measuring the surface and subsurface
distribution of the compression.
X-ray diffraction (XRD) is the most
accurate and proven method of quantifying the subsurface residual stress
distributions that develop during
MetaLL ife
or other mechanical compression processing. These XRD methods use
known standards established by ASTM and SAE associations. Prior to
taking these measurements exacting
criteria and
specifications for processing methods have to be established and
implemented. These specifications are applied to multiple coupon samples
which are then used in the XRD measurement phase.
Subsurface readings are then determined
by successive combination measurements using x-ray diffraction instruments and
then electro-polishing the surface to remove layers of material.
Electro-polishing removes material without inducing or changing the residual
stress values. This method is costly and destructive in nature so it
often is skipped by other competitive companies because it involves the removal of
the specimen coupon from the diffractometer each time to perform the
electro-polishing. This increases the amount of time required to take the
readings which is very labor intensive.
Badger uses X-ray diffraction for
quantifying residual stress distribution. The equipment allows the residual
stress in a coupon specimen to be measured. Layers of
material are electrochemically removed from the specimen. The resulting
residual stress layer is defined and recorded by a computer. All the
data obtained is properly corrected based on the penetration of the X-ray
beam and the amount of layer removal. By connecting the resulting data
points it is possible to accurately draw curves showing both surface and
subsurface compressive residual stress values.
Specifications - Compression and Surface
|
Compressive values (fatigue
resistance) |
|
46-48 Rc H-13 material - oil quenched coupons |
|
Max compressive value |
|
Max compressive depth |
|
Process |
Ksi
rounded |
MPa |
|
Process |
Inches |
mm |
|
T-21 |
150 |
1034 |
|
T-21 |
.006 |
0.1524 |
|
T-31 |
152 |
1048 |
|
T-31 |
.009 |
0.2286 |
|
T-41 |
155 |
1069 |
|
T-41 |
.012 |
0.3048 |
|
T-40 |
155 |
1069 |
|
T-40 |
.012 |
0.3048 |
|
T-41H |
160 |
1103 |
|
T-41H |
.018 |
0.4572 |
|
T-40H |
160 |
1103 |
|
T-40H |
.018 |
0.4572 |
|
T-60 |
150 |
1034 |
|
T-60 |
.014 |
0.3556 |
|
T-61 |
150 |
1034 |
|
T-61 |
.014 |
0.3556 |
|
T-70 |
125 |
862 |
|
T-70 |
.019 |
0.4826 |
|
T-71 |
125 |
862 |
|
T-71 |
.019 |
0.4826 |
Related Topics
> - Cosmetics |
Click for larger view
T-41H - High compression & maximized depth
More topography than T-41 depth
Applications - Heat checked - some breakout
PREFERRED BY MOST CUSTOMERS
T-41 - Good compression and depth
Applications - Heat checked - small breakout
T-21 - Compression but
not as much depth
Application - Core Pins , and Dies
Access limited - small radii or Zinc Dies
T-61 - High surface compression
(limited to flat surfaces and large radii))
T-71 - High surface compression and depth
(limited to flat surfaces with no
radii)
|